This blog introduces a PoC technique for spoofing call stacks using timers. Prior to our implant sleeping, we can queue up timers to overwrite its call stack with a fake one and then restore the original before resuming execution. Hence, in the same way we can mask memory belonging to our implant during sleep, we can also mask the call stack of our main thread. Furthermore, this approach avoids having to deal with the complexities of X64 stack unwinding, which is typical of other call stack spoofing approaches.
The Call Stack Problem
The core memory evasion problem from an attacker’s perspective is that implants typically operate from injected code (ignoring any module hollowing approaches). Therefore, one of the pillars of modern detection is to monitor for the creation of threads which belong to unbacked (or ‘floating’) memory. This blog by Elastic is a good approximation to the state of the art in terms of anomalous thread detection from an EDR perspective.
However, another implication of this problem for attackers is that all the implants’ API calls will also originate from unbacked memory. By examining call stacks either at the time of a specific API invocation, or by proactively inspecting running threads (i.e. ones which are sleeping), suspicious call stacks can be identified via return addresses to unbacked memory.
This is one detection area which historically has not received a huge amount of focus/research in modern EDR stacks (in my experience). However, this is starting to change with the release of open-source tools such as Hunt-Sleeping-Beacons, which will proactively inspect “sleeping” threads to find call stacks with unbacked regions. This demonstrably provides a high confidence signal of suspicious activity; hence it is valuable to EDRs and something attackers need to seriously consider in their evasion TTPs.
Call Stack Inspection at Rest
The first problem to solve from an attacker’s perspective is how to manipulate the call stack of a sleeping thread so that it can bypass this type of inspection. This could be performed by the actual thread itself or via some external mechanism (APCs etc.).
Typically, this is referred to as “spoofing at rest” (h/t to Kyle Avery here for this terminology in his excellent blog on avoiding memory scanners). The first public attempt to solve this problem is mgeeky’s ThreadStackSpoofer, which overwrites the last return address on the stack.
As a note, the opposite way to approach this problem is by having no thread or call stack present at all, à la DeathSleep. The downside of this technique is the potential for the repeated creation of unbacked threads, (depends on the exact implementation), which is a much greater evil in modern environments. However, future use of Hardware Stack Protection by EDR vendors may make this type of approach inevitable.
Call Stack Inspection During Execution – User Mode
The second problem is call stack inspection during execution, which could either be implemented in user mode or kernel mode. In terms of user mode implementation, this would typically involve hooking a commonly abused function and walking the stack to see where the call originated. If we find unbacked memory, it is highly likely to be suspicious. An obvious example of this is injected shellcode stagers calling WinInet functions. MalMemDetect is a good example of an open-source project that demonstrates this detection technique.
For these scenarios, techniques such as RET address spoofing are normally sufficient to remove any evidence of unbacked addresses from the call stack. At a high level, this involves inserting a small assembly harness around the target function which will manually replace the last return address on the stack and redirect the target function to return to a trampoline gadget (e.g. jmp rbx).
Additionally, there is SilentMoonWalk which uses a clever de-syncing approach (essentially a ROP gadget built on X64 stack unwinding codes). This can dynamically hide the origin of a function call and will similarly bypass these basic detection heuristics. Most importantly to an operator, both these techniques can be performed by the acting thread itself and do not require any external mechanism.
From an opsec perspective, it is important to note that many of the techniques referenced in this blog may produce anomalous call stacks. Whether this is an issue or not depends on the target environment and the security controls in place. The key consideration is whether the call stack generated by an action is being recorded somewhere (say in the kernel, see next section) and appended to an event/alert. If this is the case, it may look suspicious to trained eyes (i.e. threat hunters/IR).
To demonstrate this, we can take SilentMoonWalk’s desync stack spoofing technique as an example (this is a slightly easier use case as other techniques can be implementation specific). As stated previously, this technique needs to find functions which implement specific stack winding operations (a full overview of X64 stack unwinding is beyond the scope of this blog but see this excellent CodeMachine article for further reading).
For example, the first frame must always perform a UWOP_SET_FPREG operation, the second UWOP_PUSH_NONVOL (rbp) etc. as demonstrated in windbg below:
0:000> knf
#   Memory  Child-SP          RetAddr               Call Site
00           0000001d`240feb98 00007ffe`b622d831     win32u!NtUserWaitMessage+0x14
[…]
08        40 0000001d`240ff140 00007ffe`b483b576     KERNELBASE!CreatePrivateObjectSecurity+0x31
09        40 0000001d`240ff180 00007ffe`b48215a5     KERNELBASE!Internal_EnumSystemLocales+0x406
0a       3e0 0000001d`240ff560 00007ffe`b4870e22     KERNELBASE!SystemTimeToTzSpecificLocalTimeEx+0x25
0b       680 0000001d`240ffbe0 00007ffe`b6d87614     KERNELBASE!PathReplaceGreedy+0x82
0c       100 0000001d`240ffce0 00007ffe`b71826a1     KERNEL32!BaseThreadInitThunk+0x14
0d        30 0000001d`240ffd10 00000000`00000000     ntdll!RtlUserThreadStart+0x21

0:000> .fnent KERNELBASE!PathReplaceGreedy+0x82
Debugger function entry 000001cb`dda19c60 for:
(00007ffe`b4870da0)   KERNELBASE!PathReplaceGreedy+0x82   |  (00007ffe`b4871050)   KERNELBASE!SortFindString
[…]
  06: offs 13, unwind op 3, op info 2	UWOP_SET_FPREG.

0:000> .fnent KERNELBASE!SystemTimeToTzSpecificLocalTimeEx+0x25
Debugger function entry 000001cb`dda19c60 for:
(00007ffe`b4821580)   KERNELBASE!SystemTimeToTzSpecificLocalTimeEx+0x25   |  (00007ffe`b482182c)   KERNELBASE!AddTimeZoneRules
[…]
08: offs b, unwind op 0, op info 5	UWOP_PUSH_NONVOL reg: rbp.
This output shows the call stack for the spoofed SilentMoonwalk thread (knf) and the unwind operations (.fnent) for two of the functions found on the call stack (PathReplaceGreedy / SystemTimeToTzSpecificLocalTimeEx).
The key take away is that this results in a call stack which would never occur for a legitimate code path (and is therefore anomalous). Hence, KERNELBASE!PathReplaceGreedy does not call KERNELBASE!SystemTimeToTzSpecificLocalTimeEx … and so on. Furthermore, an EDR could itself attempt to search for this pattern of unwind codes during a proactive scan of a sleeping thread. Again, whether this is an issue depends entirely on the controls/telemetry in place but as operators it is always worth understanding the pros and cons of all the techniques at our disposal.
Lastly, a trivial way of calling an API with a ‘clean’ call stack is to get something else to do it for you. The typical example is to use any callback type functionality provided by the OS (same applies for bypassing thread creation start address heuristics). The limitation for most callbacks is that you can normally only supply one argument (although there are some notable exceptions and good research showing ways around this).
Call Stack Inspection During Execution – Kernel Mode
A user mode call stack can be captured inline during any of the kernel callback functions (ie. on process creation, thread creation/termination, handle access etc…). As an example, the SysMon driver uses RtlWalkFrameChain to collect a user mode call stack for all process access events (i.e. calling OpenProcess to obtain a HANDLE). Hence, this capability makes it trivial to spot unbacked memory/injected code (‘UNKNOWN’) attempting to open a handle to LSASS. For example, in this contrived scenario you would get a call stack similar to the following:
0:020> knf
#       Memory    Child-SP           RetAddr               Call Site
00                0000004c`453cf428  00007ffd`7f1006fe     ntdll!NtOpenProcess
01           8    0000004c`453cf430  00007ff6`98fe937f     KERNELBASE!OpenProcess+0x4e
02          70    0000004c`453cf4a0  000002ad`c3fd1121     000002ad`c3fd1121 (UNKNOWN)
Additionally, it is now possible to collect call stacks with the ETW threat intelligence provider. The call stack addresses are unresolved (i.e. an EDR would need to keep its own internal process module cache to resolve symbols) but they essentially enable EDR vendors the potential to capture near real time call stacks (where the symbols are then resolved asynchronously). Therefore, this can be seen as a direct replacement for user mode hooking which is, critically, captured in the kernel. It is not unrealistic to imagine a scenario in the future in which unbacked/direct API calls to sensitive functions (VirtualAlloc / QueueUserApc / SetThreadContext / VirtualProtect etc.) are trivial to detect.
These scenarios were the premise for some of my own previous research in to call stack spoofing during execution: https://github.com/WithSecureLabs/CallStackSpoofer. The idea was to offload the API call to a new thread, which we could initialise to a fake state, to hide the fact that the call originated from unbacked memory. My original PoC applied this idea to OpenProcess but it could easily be applied to image loads etc.
The key requirement here was that any arbitrary call stack could be spoofed, so that even if a threat hunter was reviewing an alert containing the call stack, it would still look indistinguishable from other threads. The downsides of this approach were the need to create a new thread, how best to handle this spoofed thread, and the reliance on a hard coded / static call stack.
Call Stack Masking
Having given a brief review of the current state of research in to call stack spoofing, this blog will demonstrate a new call stack spoofing technique: call stack masking. The PoC introduced in this blog post solves the spoofing at rest problem by masking a sleeping thread’s call stack via an external mechanism (timers).
While researching this topic in the past, I spent a large amount of time trying to get to grips with the complexities of X64 stack unwinding in order to produce TTPs to perform stack spoofing. This complexity is also present in a number of the other techniques discussed above. However, it occurred to me that there is a much simpler way to spoof/mask the call stack without having to deal with these intricacies.
If we consider a generic thread that is performing any kind of wait, by definition, it cannot modify its own stack until the wait is satisfied. Furthermore, its stack is always read-writable. Therefore, we can use timers to:
- Create a backup of the current thread stack
- Overwrite it with a fake thread stack
- Restore the original thread stack just before resuming execution
Any timer objects could be used, but for convenience I based my PoC on C5Spider’s Ekko sleep obfuscation technique.
The only remaining challenge is to work out the value of RSP once our target thread is sleeping. This can be achieved using compiler intrinsics (_AddressOfReturnAddress) to obtain the Child-SP of the current frame. Once we have this, we can subtract the total stack utilisation of the expected next two frames (i.e. KERNELBASE!WaitForSingleObjectEx and ntdll!NtWaitForSingleObject) to find the expected value of RSP at sleep time.
Lastly, to make our masked thread look as realistic as possible, we can copy the start address and call stack of an existing (and legitimate) thread.
PoC || GTFO
The PoC can be found here: https://github.com/Cobalt-Strike/CallStackMasker.
The PoC operates in two modes: static and dynamic. The static mode contains a hard coded call stack that was found in spoolsv.exe via Process Explorer. This thread is shown below and can be seen to be in a state of ‘Wait:UserRequest’ via KERNELBASE!WaitForSingleObjectEx:
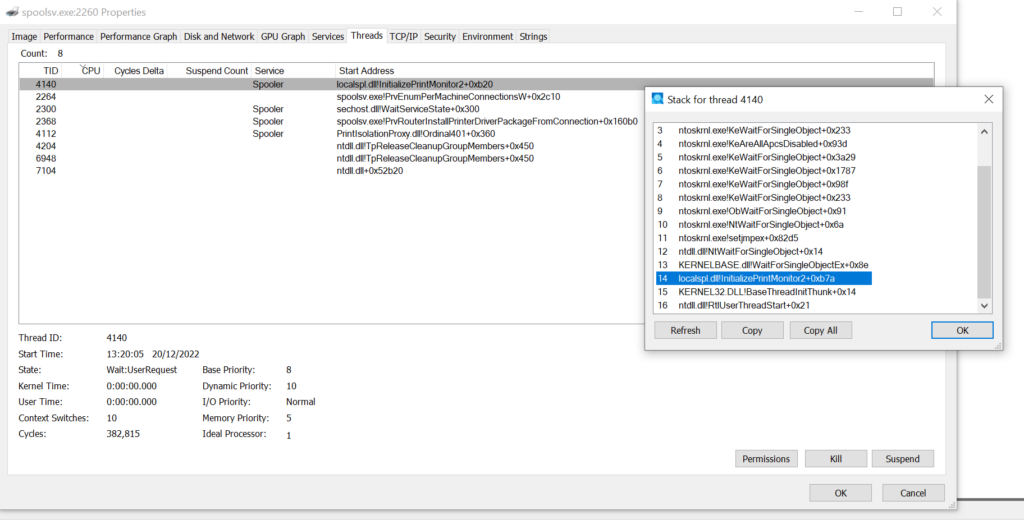
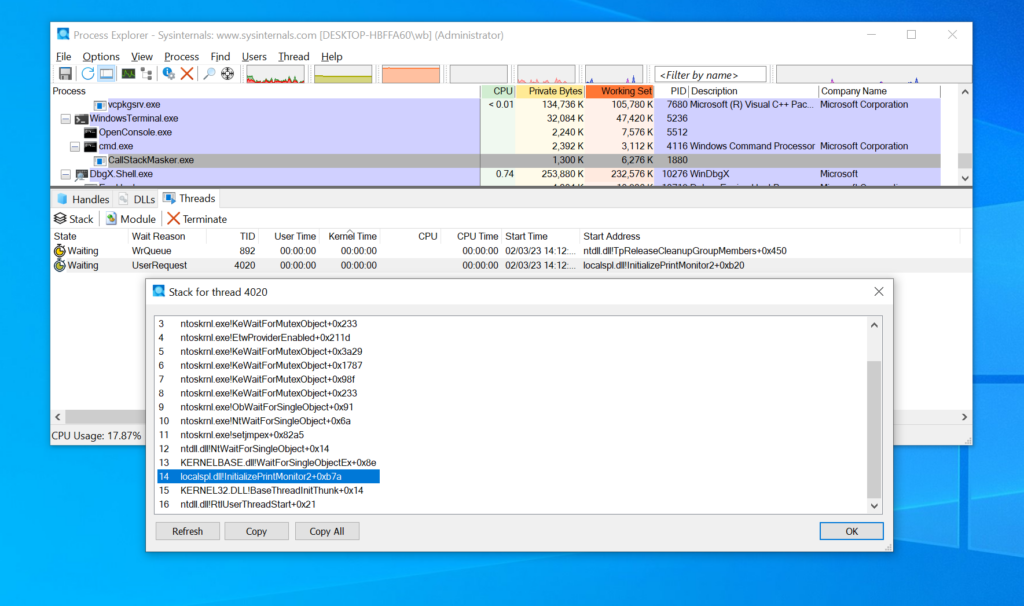
The screenshot below demonstrates static call stack masking. The start address and call stack of our masked thread are identical to the thread identified in spoolsv.exe above:
The obvious downside of the static mode is that we are still relying on a hard coded call stack. To solve this problem the PoC also implements dynamic call stack masking. In this mode, it will enumerate all the accessible threads on the host and find one in the desired target state (i.e. UserRequest via WaitForSingleObjectEx). Once a suitable thread stack is found, it will copy it and use that to mask the sleeping thread. Similarly, the PoC will once again copy the cloned thread’s start address to ensure our masked thread looks legitimate.
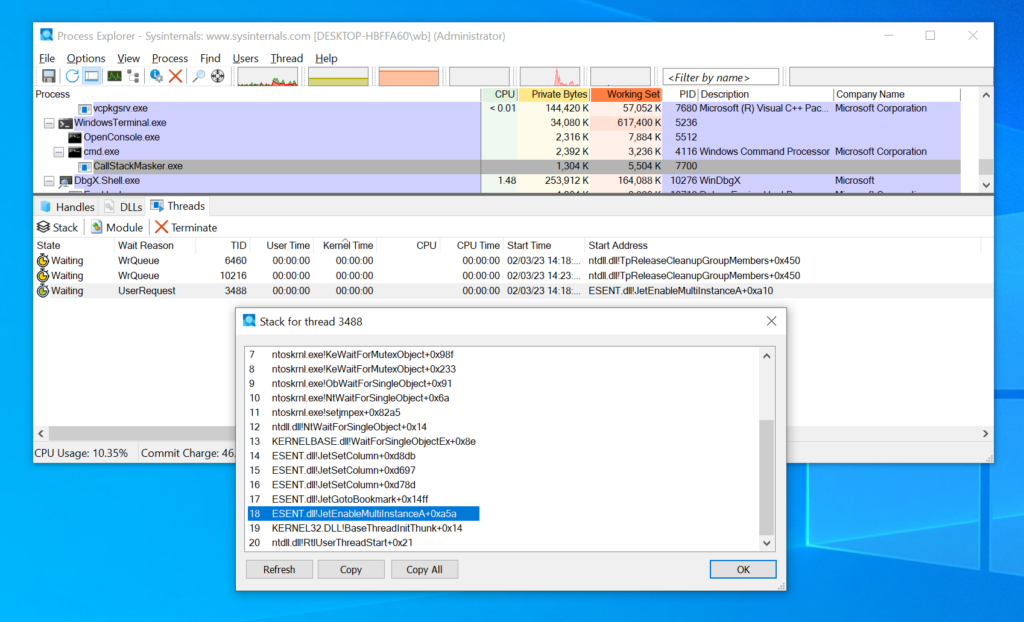
If we run the PoC with the ‘–dynamic’ flag, it will locate another thread’s call stack to mimic as shown below:
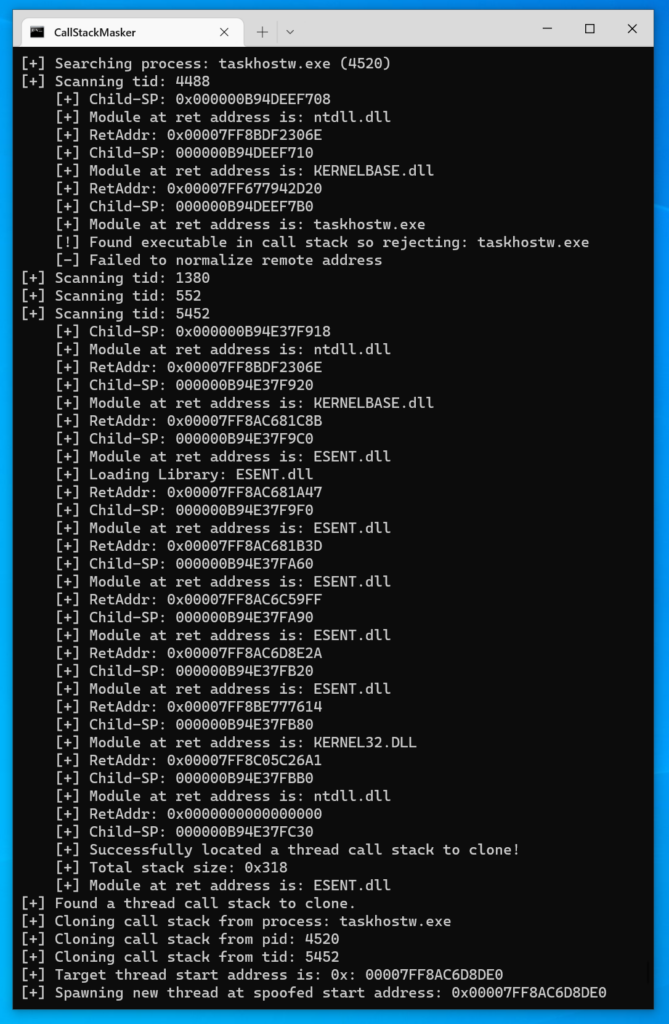
The target process (taskhostw.exe / 4520), thread (5452), and call stack identified above are shown below in Process Explorer:
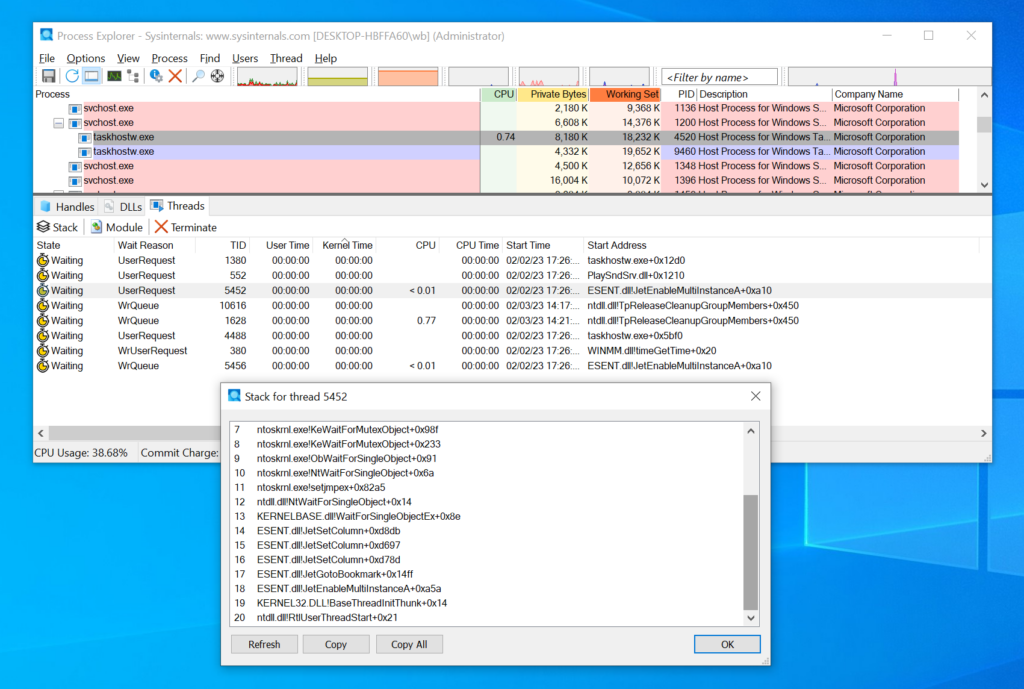
If we now examine the call stack and start address of the main thread belonging to CallStackMasker, we can see it is identical to the mimicked thread:
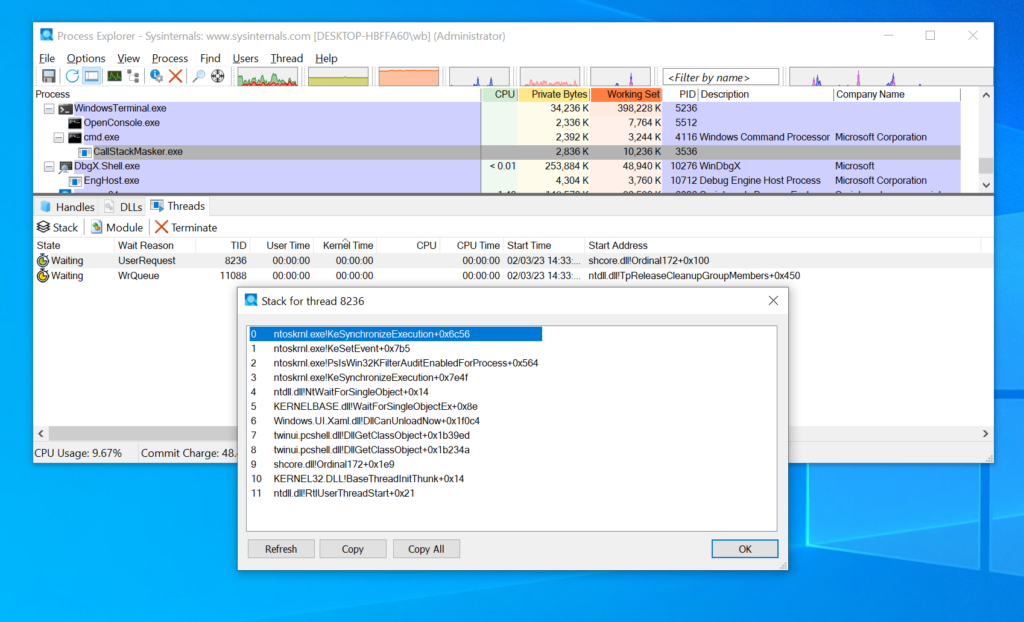
Below is another example of CallStackMasker dynamically finding a shcore.dll based thread call stack from explorer.exe to spoof:
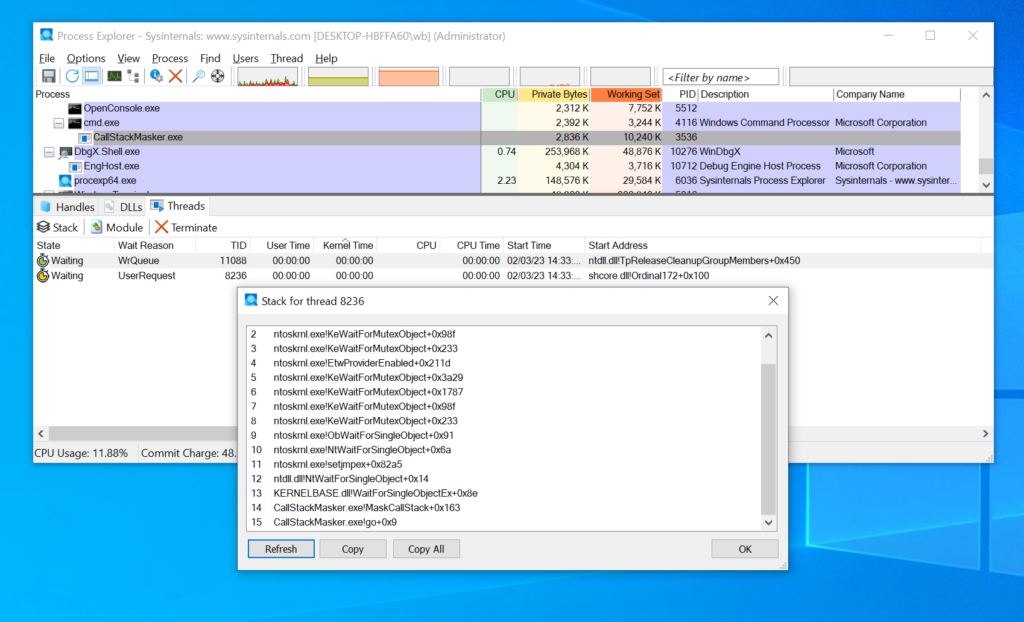
The screenshot below shows the real ‘unmasked’ call stack:
Currently the PoC only supports WaitForSingleObject but it would be trivial to add in support for WaitForMultipleObjects.
As a final note, this PoC uses timer-queue timers, which I have previously demonstrated can be enumerated in memory: https://github.com/WithSecureLabs/TickTock. However, this PoC could be modified to use fully fledged kernel timers to avoid this potential detection opportunity.