Two weekends ago, I ran my Advanced Threat Tactics course with a group of 19 people. During the end exercise, one of the teams was frustrated. Their team server was incredibly slow, like mollasses. I asked the student with the team server to run top and I noticed the ruby process for msfrpcd was consuming all of the CPU. I mentioned that I had seen the issue to which the student leaned back, crossed their arms and responded “oh, great, I guess my 2-cores and 4GB of RAM aren’t enough–harumph!”
I wasn’t fibbing to sweep the issue under the rug. I have seen this behavior before, for the last year actually. It frustrated me too, but I was never able to isolate it. In this blog post, I’d like to share with you the story of this bug and how I managed to isolate it. I hope this will help you with tracking down issues you encounter too.
To scan through a pivot, Armitage has a feature I call MSF Scans. This feature will run auxiliary/scanner/portscan/tcp to discover services and follow it up with several auxiliary modules to further enumerate the open services.
I noticed on some virtualized systems that following this process would lead Ruby to consume CPU for an entire core, making the Metasploit Framework non-responsive. On Amazon’s EC2, a micro instance would nearly always trigger with this problem. It’s this reason I recommend that Armitage and Cobalt Strike users use a high CPU EC2 instance.
When a thread is so busy that it consumes all of the CPU, we refer to this problem as resource starvation. This busy thread is preventing other threads from running as often as they normally would, making the whole system feel slow.
I took a look at the virtual machine I gave out in class to see if I could reproduce the problem. Most of the time, when I would run a scan–everything was OK. If I opted to run multiple scans at once (uncoordinated teams sharing one Metasploit Framework instance do this a lot), then I was much more likely to trigger this problem. When I ran multiple scans through a pivot enough times, I would reliably trigger this CPU starvation condition.
Reliably reproducing a problem is the first, and often hardest step in actually fixing it.
Next, I had to figure out where this problem was happening. In Java, there’s a way to dump a stracktrace of every running thread to STDOUT (use kill -3 [pid] to do this). Ruby has a gem called xray which will sort-of do this. By default it only dumps the current thread. If I wanted to patch Ruby, apparently I can get it to dump all threads. I decided to look for another option.
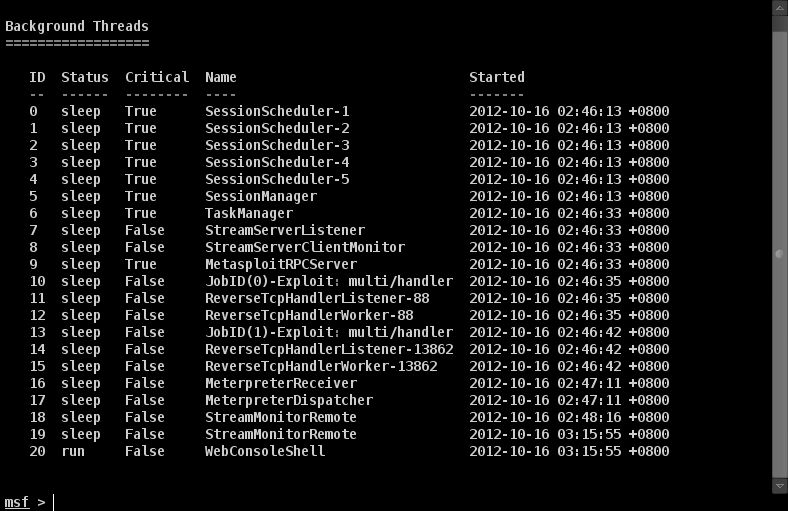
The Metasploit Framework has a threads command. Typing threads by itself will list the threads spawned by the framework:
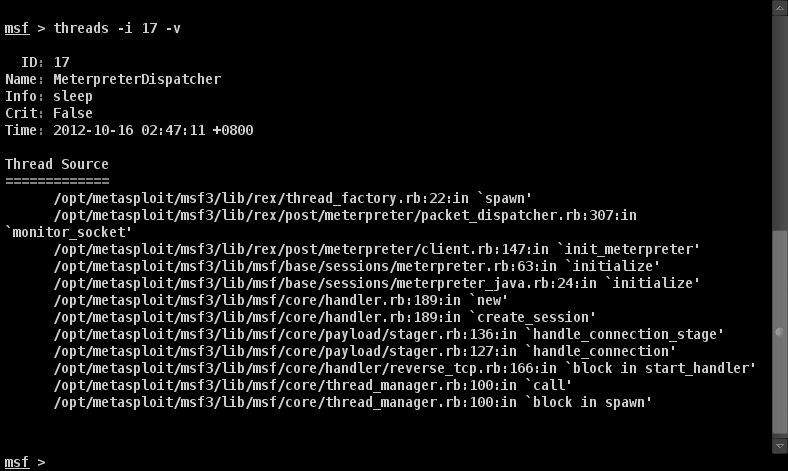
If you type threads -i [number] -v you will see a stacktrace for that thread.
You may also use threads -k [number] to kill a thread.
Armed with this information, I opted to trigger the CPU starvation condition and kill threads one at a time until the CPU spinning stopped.
I had an inkling that one of the threads created by the auxiliary/scanner/portscan/tcp module was the cause of this CPU use. I kept examining and killing threads until the only ones left were the MeterpreterDispatcher and MeterpreterReceiver threads.
When I killed my meterpreter session, the CPU use went to a normal level. When I killed all jobs and threads related to my portscan, the CPU use stayed at the high level. Conclusion? The problem is in the MeterpreterDispatcher and MeterpreterReceiver threads–somewhere.
I dumped the stacktrace for these threads. I then started at the top and looked at thread_factory.rb. I had this crazy notion that each framework thread checks out a connection from the postgres database. Maybe I exhausted this pool somehow (or something wasn’t giving back to this pool) and this would cause further thread creation to block, possibly forcing some code into a busy wait state. This assumption was not correct.
I took a look at the next spot in the stacktrace, packet_dispatcher.rb.
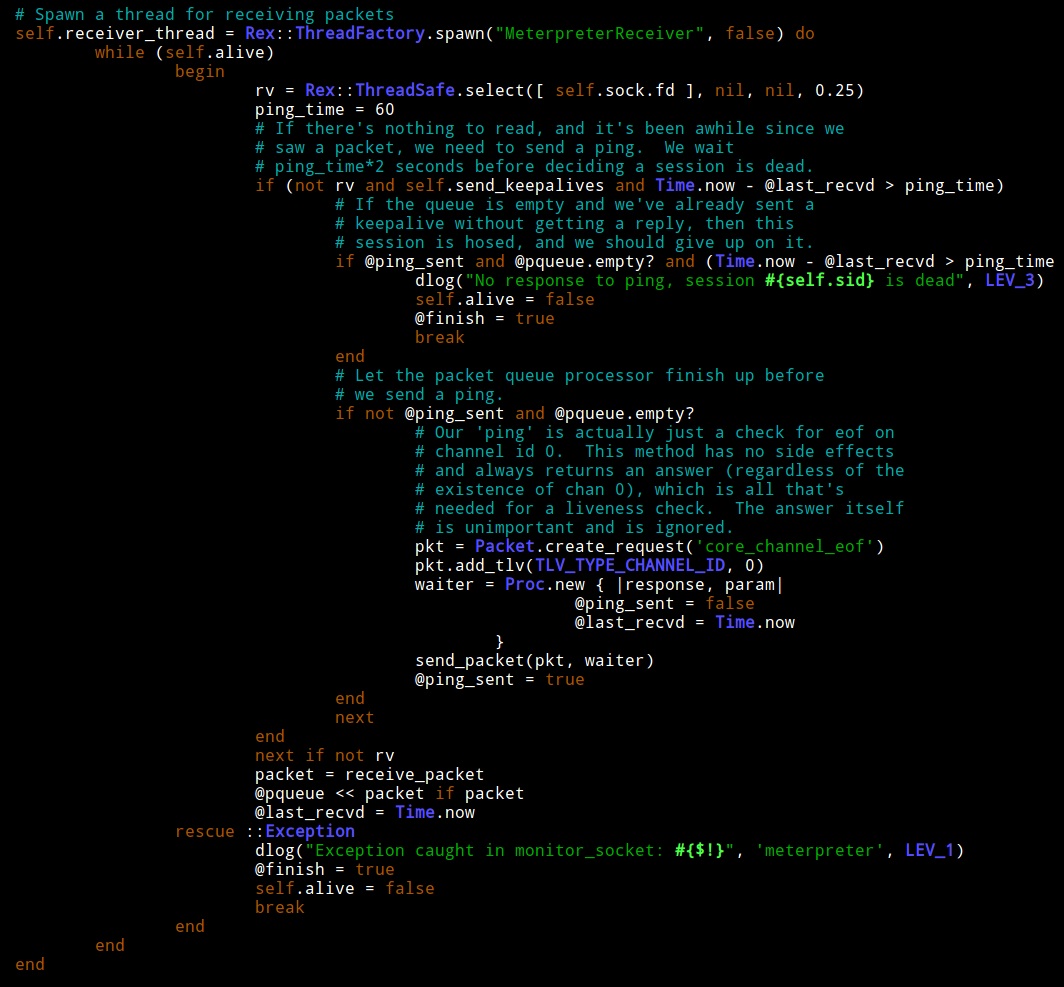
Line 255 of packet_dispatcher.rb is the start of the code for the MeterpreterReceiver thread.
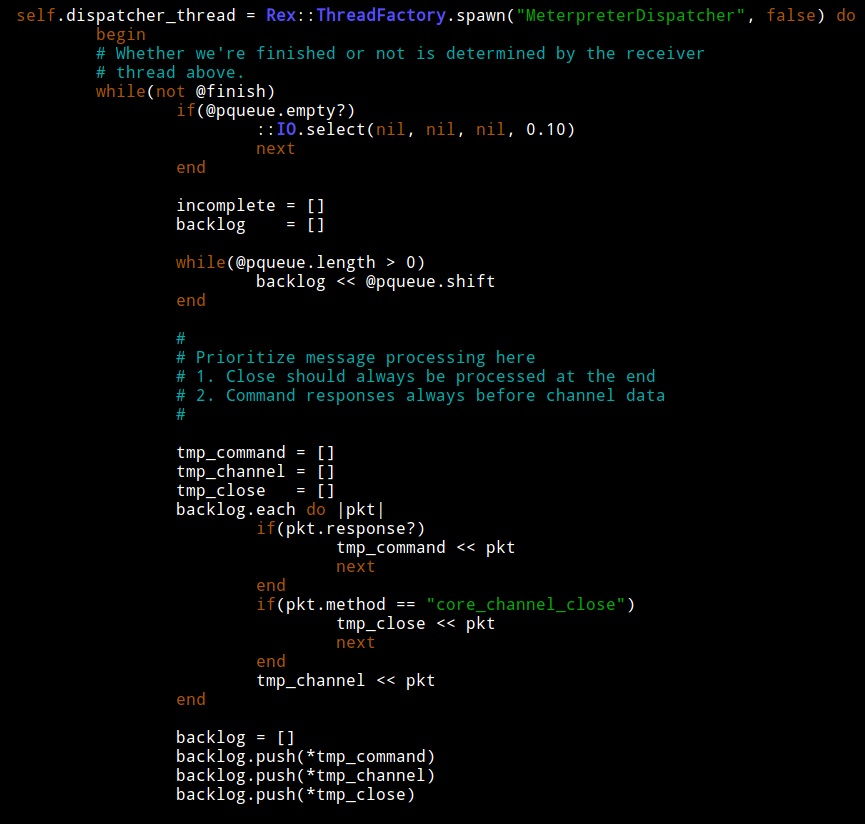
Line 307 of packet_dispatcher.rb is the start of the code for the MeterpreterDispatcher thread.
You may use p to print any Ruby data structure to the console or wlog to log a string to the framework.log file in ~/.msf4/logs. I added a few p statements to these two threads so I could understand what they were doing. For example:
p "The size of @pqueue is #{@pqueue.length}"
When I triggered my CPU consumption condition, I noticed something strange.
MeterpreterDispatcher would loop inspecting the size of a variable called @pqueue. At the beginning of this loop, @pqueue would always have one or two items. This thread only sleeps when @pqueue is empty. This is OK, because the MeterpreterDispatcher loop clears @pqueue during each iteration.
How do values get into @pqueue? I took a look at MeterpreterReceiver. This thread will add values to @pqueue. According to my debug output though, the MeterpreterReceiver thread was not adding values to @pqueue when my bad loop was hit.
I looked closer and noticed that at the end of MeterpreterDispatcher there is a check. The thread will try to process a packet and if it can’t, it will insert it back into the queue. Interesting.
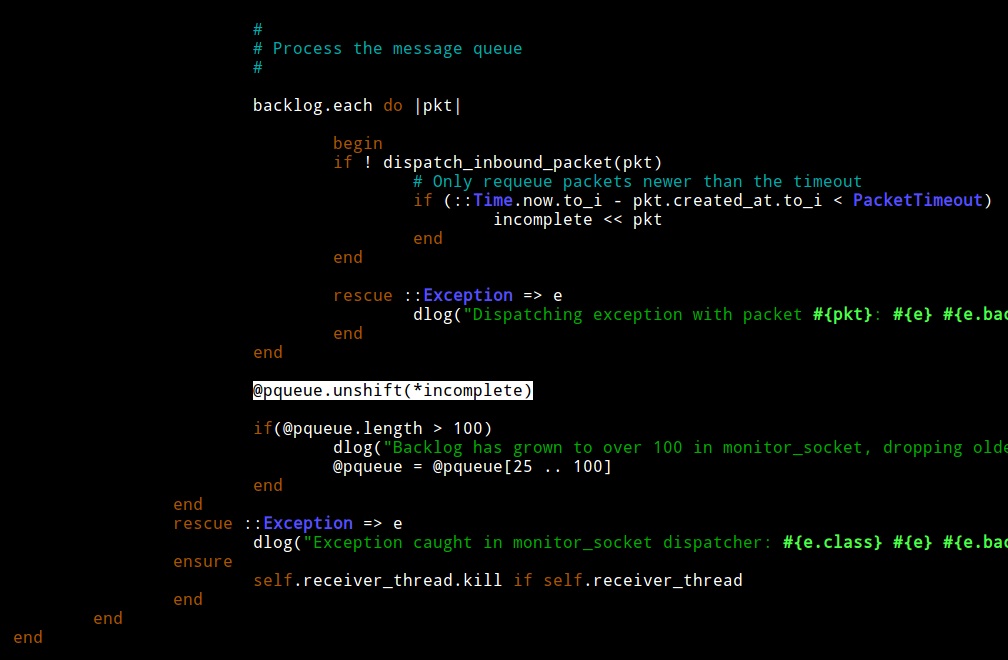
If MeterpreterDispatcher can not process a packet (for whatever reason), it adds it to the queue. The queue is no longer empty so it is guaranteed to try again without sleeping. If MeterpreterDispatcher can not process the packet again, it adds it to the queue. Bingo… I found my resource starvation opportunity, almost.
MeterpreterDispatcher has a check to take a packet off of this treadmill. If this check takes incompletely processed packets from the queue, then I’m wrong again. I examined the code and saw that the packet timeout value is 600s or 10 minutes. When a packet is not processed, it’s added to the queue, again and again until it’s processed or 10 minutes pass. This explains why the problem would show up and go away if I left the framework alone for a time.
At this point, I wrote a simple patch to sleep when the packet queue is populated entirely with packets it couldn’t process. I submitted my pull request and after egypt was able to verify the issue, the issue was closed. I’m always amazed by the responsiveness of the Metasploit Framework dev team.
I hope you enjoyed this post mortem. I wrote this post because I’d like to encourage you to dig into the weird issues you encounter and try to solve them. Sometimes, you’re the person with the right environment and situation to trigger a hard to reproduce issue. The Metasploit Framework team did a wonderful job providing us tools to inspect what the framework is doing. With these tools, you can isolate these complicated issues–even if you’re not much of a Ruby programmer. Fixing bugs is an important way to contribute to an open source project. A module may delight folks with their new found powers, but a bug fix will save stress, frustration, embarrassment, and potentially counseling costs for thousands of people. I’m happy this one is fixed.
